CA's Housing Policy flawed ?
Evidence from Residential Vacancy Chains 2024 paper by
Valentine Gilbert
VIDEO: MYTH of the "Vacancy Chain" effect on Affordable Housing:
https://youtu.be/tD9kngxSrmM
CA not
focused on VERY LOW income families
https://www.youtube.com/watch?v=BekIUiZQPmE
CA's flawed
"Vacancy Chain" effect on
Affordable Housing
| |
|
REBUTTAL |
The California Policy to promote housing, ( not
just for LOW income households, but for MODERATE and ABOVE MODERATE income Households),
is based on a
2019 working paper by economist
Evan Mast
titled
"The Effect of New Market-Rate Housing on the Regional Housing Market".
( The VACANCY CHAIN from a household's move to a new Market Rate home.
)
This paper is frequently cited to justify policies that promote the
construction of "MODERATE and ABOVE MODERATE" (market-rate or luxury)
housing as a primary tool for broader Affordability.
But Mast's paper tracks
people moving, not
actual rent prices.
And there's a more recent STUDY that contradicts the paper : a 2024 paper by
Valentine Gilbert, VACANCY CHAINS are
often shorter than previously estimated and that new suburban housing has almost no measurable
effect on low-income urban
affordability.
 | Most vacancies are created within one year of
the initial move. |
| New suburban single-family housing has a negligible
effect on urban housing affordability.
Each new suburban home leads to only 0.015 moves in low-income,
high-density urban neighborhoods. |
| High-income urban multifamily housing primarily
creates vacancies in other high-income tracts (71% in the first round). |
Summary
Research into how different housing submarkets are interconnected through
residential vacancy chains—the series of moves initiated by the
construction of a new housing unit. By analyzing administrative data on the
residential histories of the U.S. population and conducting economic
simulations, the research evaluates whether suburban housing expansion can
alleviate the housing affordability crisis in dense urban centers.
Critical Takeaways:
| Vacancy Chains are Short: Approximately 90% of vacancy chains
initiated by new construction end within three migration rounds.
Most vacancies are created within one year of the
initial move. |
| Limited Cross-Market Impact: New suburban
single-family housing has a negligible effect on urban housing
affordability. Each new suburban home leads to only 0.015 moves in
low-income, high-density urban neighborhoods. |
| Submarket Stickiness: While vacancy chains do connect disparate
submarkets (e.g., high-income to low-income), the connections are weak.
High-income urban multifamily housing primarily
creates vacancies in other high-income tracts (71% in the first round). |
| Predictive Power of Vacancies: The number of vacancies created in
a neighborhood is as strong a predictor of price effects as complex,
model-derived substitution effects, making vacancy chains a practical metric
for predicting the non-local impacts of new housing. |
| The Scale Paradox: Although suburban housing is less efficient at
creating urban vacancies on a per-unit basis than urban multifamily housing,
the sheer volume of suburban construction (accounting for 80% of supply
growth) means it has collectively created more total vacancies in low-income
urban tracts than new high-income urban developments. |
1. The Context: Urban Demand vs. Suburban Supply
Over the past thirty years, U.S. cities have experienced a divergence in
housing trends. Real home prices and rents in dense urban centers have grown
more rapidly than in suburban areas (45% vs. 30% between 1990 and 2018).
Conversely, 80% of new housing supply growth occurred in low-density suburbs,
while the 10% of tracts closest to city centers accounted for less than 3% of
supply growth.
This raises a fundamental policy question: Can suburban expansion reduce
urban costs, or must cities grow denser to become affordable? The research
addresses this by examining the degree of residential mobility between these
submarkets.
2. Understanding Residential Vacancy Chains
A vacancy chain is the sequence of residential moves triggered by a single
new unit:
- First Link: A household moves into a newly constructed unit,
potentially leaving their previous unit vacant.
- Subsequent Links: Another household moves into the vacated unit,
leaving their own unit vacant, and so on.
- Termination: The chain ends if a unit is not vacated (e.g., a new
household forms), if the unit remains vacant/is demolished, or if the mover
comes from outside the market (e.g., international migration).
|
|
Recent real-world
data from Austen
and
Minneapolis
are frequently used by economists to demonstrate that
massive supply increases can
directly lower rents across an entire market.
Austin, Texas: The " Supply Surge" Example,
became a national case study in 2023–2024 when it added more apartment
units per capita than any other major U.S. city.
|
Rent Declines: By mid-2024, Austin's median
rent had fallen by 6.6% to 7%
year-over-year. Some data showed declines of up to 17.1% from the 2022 peak for certain unit
types. |
|
The "Escalator" Effect: Research by
Pew Charitable Trusts
found that adding new market-rate housing
actually led to the
steepest rent drops in Class C buildings (older, less expensive
units).
 |
Class A (New/Luxury): -2.6%
rent growth. |
|
Class C (Older/Affordable):
-11.4% rent growth. |
|
|
Mechanism: As high-income renters "traded
up" to new luxury buildings, landlords of older buildings were forced to
offer significant concessions
(like 1–2 months free rent) and lower base rents to remain competitive. |
Minneapolis, Minnesota:
Zoning Reform Results
was the first major U.S. city to eliminate single-family-only zoning and scrap parking minimums.
|
Bending the Curve: While rents rose nationally by double digits
post-pandemic,
rents remained
remarkably stable. Between 2017 and 2024,
increased its housing stock by roughly
12%, resulting in rent growth
that was 13% lower than the rest of the state. |
|
Actual vs. Counterfactual: A
2025 study from the Minneapolis Fed estimated that without these supply reforms, rents
would have been
17.5% to 34% higher than they are today. |
|
Affordability Impact: Families
are estimated to save
$1,700 per year in rent compared to what they would have paid if
the city followed statewide trends. |
Annual Change In Rent
by Metro Areas (April 2024) 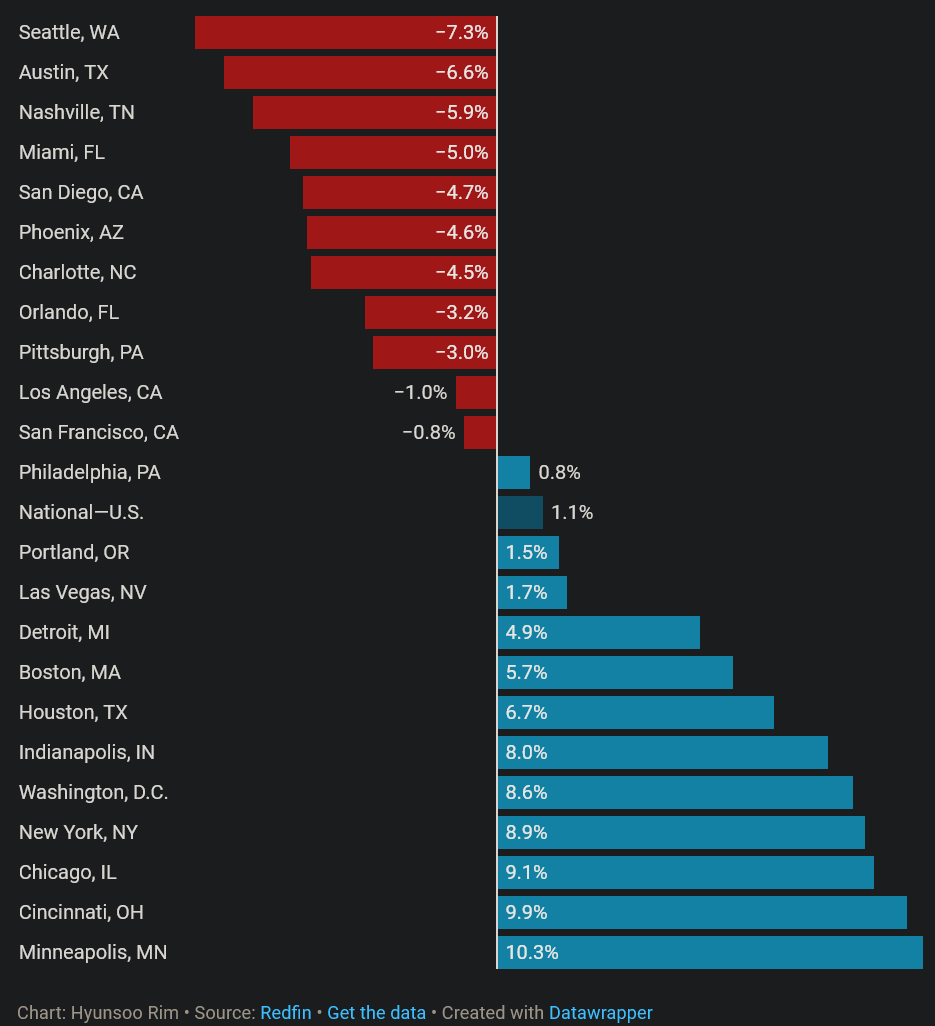
Median Asking Rent By
Metro Areas (April 2024)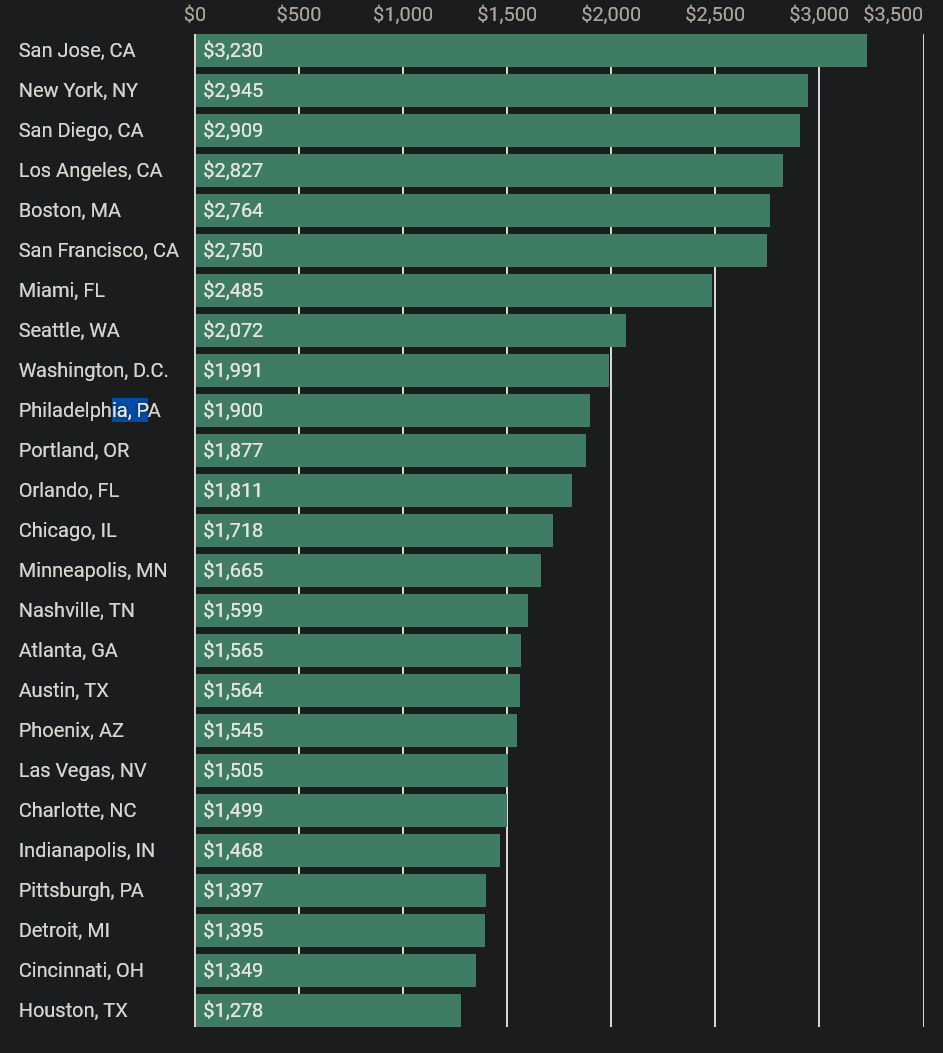
|
Theoretical Framework
The research utilizes a "residential diversion ratio" to capture how
households substitute between neighborhoods. Price effects of new supply in
one submarket on another consist of:
| Direct Effects: Proportional to the diversion ratio between the
two specific submarkets. |
| Indirect Effects: Proportional to the product of diversion ratios
across a chain of intermediary submarkets (the vacancy chain). |
--------------------------------------------------------------------------------
3. Methodology and Data Scope
The study utilizes the Census Bureau’s Master Address File (MAF) and
MAF Auxiliary Reference Files (MAF-ARF) to construct residential
histories for the entire U.S. population from 2000 to 2021.
| Sample: 1.5 million new units (single-family suburban and
multifamily urban) built between 2009 and 2018 across the 17 most populous
U.S. metropolitan areas. |
| Housing Types Analyzed:
| Low-Density Suburban Single Family (SSF): Homes in below-median
density tracts outside the principal city. |
| High-Income Urban Multifamily (UMF): Units in 20+ unit
buildings in above-median income tracts within five miles of the Central
Business District. |
|
--------------------------------------------------------------------------------
4. Descriptive Findings: The Lifecycle of Vacancy Chains
Chain Length and Duration
The research establishes that vacancy chains are generally short lived:
| 90% of chains terminate within three rounds of moves. |
| The cumulative number of vacancies levels off by the sixth round. |
| Most effective vacancies are created within a one-year horizon of
the initial move; chains do not grow substantially longer when followed over
a four-year period. |
Submarket Connectivity and Income
The composition of vacancies shifts as chains progress, but the starting
point heavily influences the outcome:
| Metric |
High-Income Urban Multifamily (UMF) |
Low-Density Suburban Single Family (SSF) |
| Total Vacancies per Unit (4-yr) |
~0.9 |
~0.9 |
| Round 1 Vacancies (Top Quintile Income) |
71% |
40% |
| Round 6 Vacancies (Below-Median Income) |
37% |
44% |
| Vacancies in Low-Income Tracts |
0.15 |
0.25 |
| Vacancies in Low-Income/High-Density |
0.03 |
0.015 |
Regional vs. Local Impact
| UMF Impact: Primarily loosens demand in the highest-end segments.
It takes 50 new high-income urban units to generate
just one vacancy in a low-income, very high-density tract. |
| SSF Impact: While SSF creates more vacancies in below-median
income tracts per unit than UMF, its connection to the densest urban centers
is even weaker, requiring 100+ units to generate a single vacancy in a
low-income, high-density neighborhood. |
--------------------------------------------------------------------------------
5. Simulation Exercise: Price and Welfare Effects
The researchers conducted 1,000 simulations to link observed vacancy chains
to unobserved economic outcomes.
| Average Elasticity of Urban Rent Premium: -0.3 (meaning a 10%
increase in supply correlates with a 3% decrease in the urban rent premium). |
| Predictive Value: The number of vacancies created in a
neighborhood is a highly accurate predictor of price and welfare effects.
This is significant because vacancy chains are easier to observe than the
complex cross-price demand parameters usually required for such economic
modeling. |
| Geographic Variation: Welfare and price benefits are not
distributed equally. They are strongly correlated with the geographic
distribution of moves within the vacancy chains. |
--------------------------------------------------------------------------------
6. Conclusion and Policy Implications
The research challenges the "supply-skeptical" view by confirming that new
market-rate housing does create vacancies in lower-income segments
through filtering. However, it also qualifies the "pro-supply" view by showing
that the geographic and categorical incidence of these benefits is
highly localized.
Final Assessment: Continued suburban expansion
is an ineffective tool for addressing urban housing affordability for
low-income households.
Because vacancy chains are short and submarkets are only weakly connected, increasing the supply of housing in one area (the suburbs)
does not meaningfully ripple into the most constrained segments of another
area (the urban core).
To alleviate rising costs in dense urban centers, policy must focus on
increasing density and supply within those specific central neighborhoods.
|